How Marketing Teams Should Optimize Website for Conversions that Align with B2B Sales
You might have heard before that marketing and sales can sometimes experience the business version of a sibling rivalry, but it’s not quite what you think.
Within business-to-business (B2B) organizations, marketing’s focus is on generating leads, while sales focuses on getting those leads to close. A disconnect happens when your marketing team (with good intentions) focuses on volume over quality, therefore resulting in passing over a high volume of leads to sales that just won’t close.
In this article, we’ll walk through a framework for how to categorize leads that come in through your website, how to build website messaging and landing pages that are consistent and relevant for each type of category, and how to optimize for intent as you go.
A General Framework for Categorizing Website Leads
It might seem obvious that your marketing team should focus on quality over quantity, or ideally both at the same time, but in practice the two can get a bit muddled.
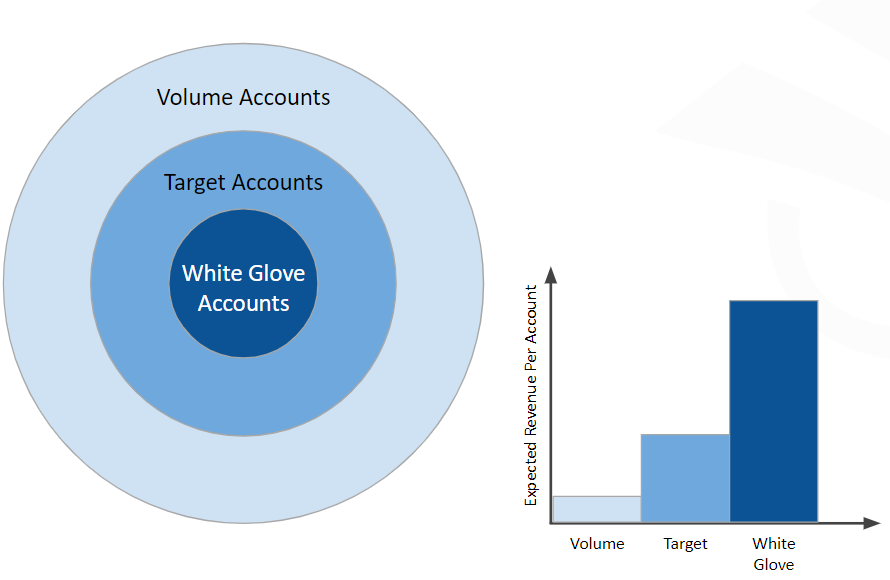
We recommend generally categorizing leads into three different buckets:
- High volume, high intent. These leads should be sent to sales and prioritized.
- High quality, Low intent. These leads should be sent to a nurture funnel where they continue to be educated and engaged.
- Low quality. These should get filtered out altogether, or directed to a different offer.
Ultimately, we’re talking about being more efficient with qualification by allowing your website to do a lot of the work for you.
This includes building consistent messaging for each lead category, building and presenting relevant landing pages for those people, and optimizing for intent as you go.
Create Messaging that’s Consistent and Relevant
In order to qualify each website visitor as a member of one of the lead categories above, you’ll need to be able to automatically consider two things before displaying website content:
- How that person got to your website. The messaging on the page they visit should be consistent with the email, ad, social posts, blog post content, or search result that preceded it.
- Their business demographic. Use marketing automation, CRM and / or 3rd party data to ensure that messaging is also relevant to their business size or industry. Focus on the industries and business sizes that have an expected value for your sales teams, and send all others into the low quality bucket.
One effective way to do so is to display case studies from relevant industry competitors, if you have them available.
For example, if someone from Wells Fargo visits your fintech website, they’ll likely respond more positively to a landing page with logos or success stories from Chase or Bank of America then from Investopedia or Stripe. If that’s not in the cards for you, focus on business size first. Before showing a Wells Fargo visitor logos from a fintech startup, show a success story from Macy’s, Delta, or another enterprise business.
This example from Shopify that’s optimized to attract businesses in e-commerce fashion. The logos and success stories listed on the page include e-commerce fashion brands, like AdoreMe, Cee Cee’s Closet and Coco and Breezy, immediately signaling to other fashion e-commerce companies that Shopify’s solution might be a good fit for them.

FunnelEnvy offers reverse IP, or account matching, and real time data integration to help marketers surface insights that allow them to display industry-specific webpages like these.
We also help companies display pages based on other types of data, like funnel stage, company size, and more.
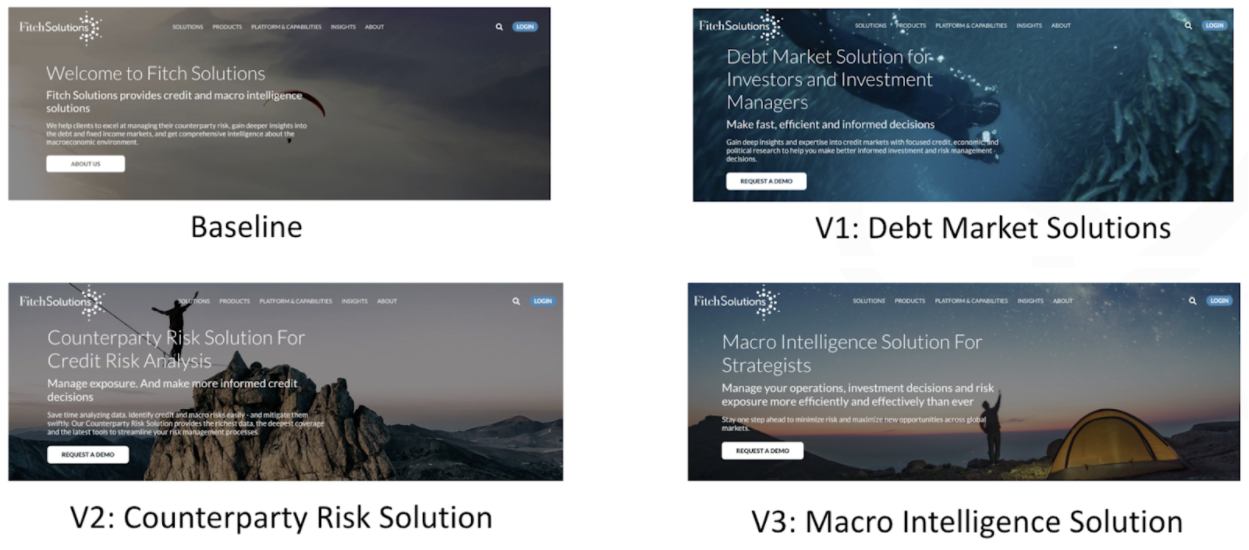
This example from a large call center showcases how experimenting with personalized offers on their website by buyer segment led to an increase in qualified leads.

In fact, MQLs increased by 10X between March and June of 2020.

Landing pages that set the right expectations
Your landing pages essentially start the sales process by presenting your products to people for the first time. For them to be effective, they need to accomplish two things:
- Mimic your sales people. This should be true for every lead category. Once a person converts through your website and makes it to the stage where they speak to sales, they shouldn’t receive an entirely different message than what led them to convert in the first place.
- Clearly communicate what each site visitor should expect next. This will change depending on the lead category. If your site visitor is categorized as “high quality, high intent” and on their way to talking to a sales person, tell them that. If they’re getting redirected to a different offer or getting more information sent to their inbox, tell them that instead.
One common mistake we see companies make is sending leads to a discovery meeting with a sales development representative (SDR) after they register for a demo. They’re expecting to see the product, when in fact, they end up in a frustrating meeting where they’re asked a lot of questions, afterwards which the real demo is scheduled depending on how they’ve qualified.
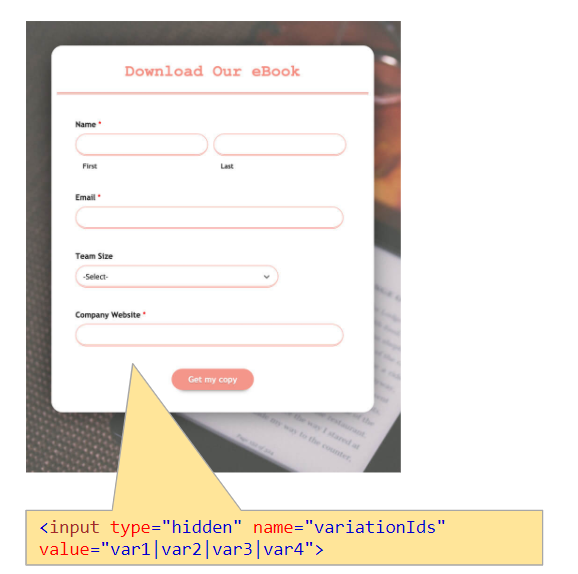
One way to rectify this is to make the discovery process part of the inbound flow, like we do at FunnelEnvy.
Our quick questionnaire helps us to categorize site visitors that convert so that we can set expectations for what will happen next, once they’ve completed the form.

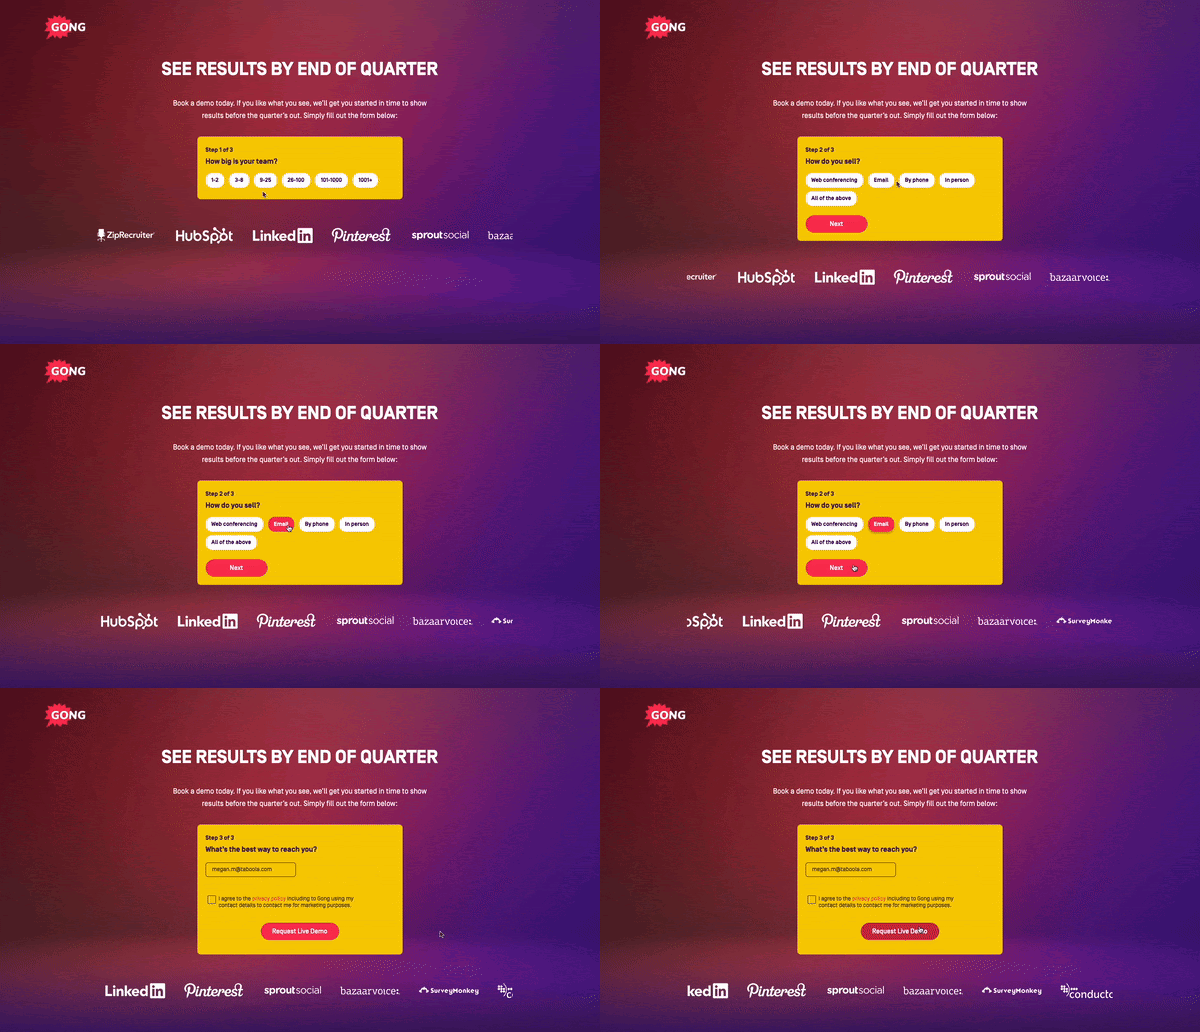
Here’s another example that qualifies leads using company size and sales strategy:
Optimizing for intent as you go
You’ve created messaging for each lead category and set up your landing pages so that the right expectations are set. Now it’s time to take it a step further by putting in place a mechanism to filter out low-quality leads or show them a different offer.
If a website visitor that’s not a highly valuable lead for your sales team comes along, you’ll want to be able to identify them with data that reveals their business size, industry, title, or any other identifying signal that makes a difference for you.
If someone comes along that doesn’t fall into any of the buckets you’ve identified as high value, consider sending them to your self-service solution (if one exists) or including a message upfront that right now, you’re just not the right fit for one another.
While it might seem scary to direct some leads away from sales, it can actually improve your sales team’s productivity and have a positive impact on revenue.
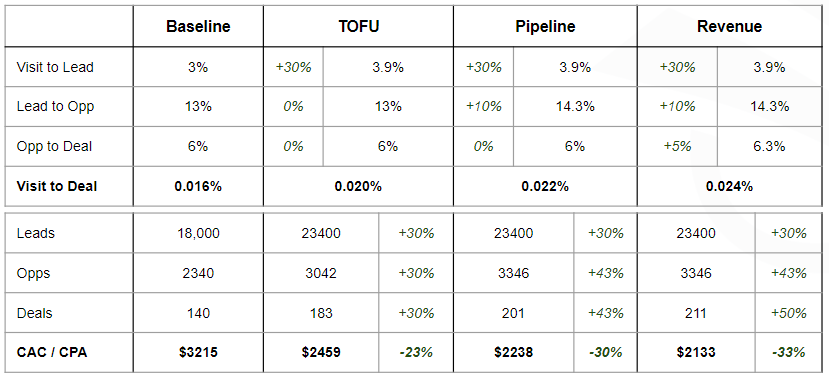
Working with FunnelEnvy, one startup increased their monthly marketing qualified leads (MQLs) by 30%, and grew revenue from closed or won deals by 250% the following quarter. Here’s what that success looks look over time:
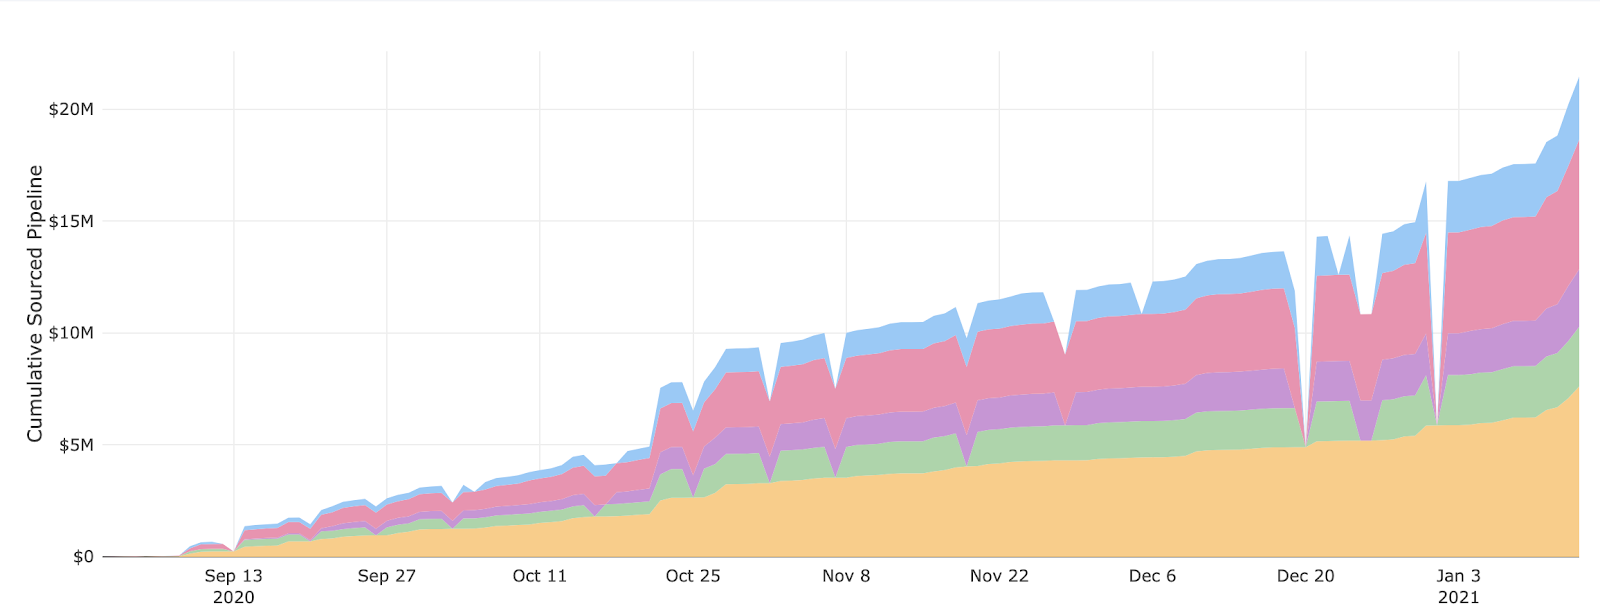
This success came from optimizing their website to align with their B2B sales strategy, and by only surfacing high quality leads to their sales teams that were ready to buy.
Bonus: treat your high quality leads like gold
Those leads that are high quality and have the appropriate purchase intent should be treated like gold.
To ensure that your sales team is successful, make sure there’s an established service-level agreement (SLA) on when and how sales is following up on those leads. For example, Marketo’s sales team commits to a 24-hour SLA.
If a tight 24-hour turnaround isn’t in the cards for you, automate your follow-up process with marketing automation or your customer resource management (CRM) software.
End the infamous sibling rivalry
The infamous sibling rivalry amongst marketing and sales isn’t actually a sibling rivalry at all — in fact, it only exists when these teams try to help one another in the wrong way.
Your website can do most of the heavy lifting to close this gap and help to qualify leads that are sent to sales automatically.
If you’re looking for a custom solution to help personalize your website content for leads of different types, FunnelEnvy can help — contact us.

