Finding the Right Analytics Operator for Your Marketing

Software is essential for successful B2B marketing campaigns, but it’s only half the battle. You can have the most sophisticated software deployed on top-of-the-line hardware – but if you don’t have the right people running it, you won’t maximize your (likely significant) investment into these resources. It’s like racing with a souped-up car driven by someone who’s never been behind the wheel.

You need your marketing tools and the people using them to be well-aligned so that your organization can take full advantage of today’s technology. Whether you’re running complicated data analytics platforms driven by AI and machine learning or a simple email marketing automation platform doesn’t matter. The people responsible for them need to be well-suited for the role and equipped with everything they need to be successful.

In this article, we’ll go over a few different ways you can find the right operator for your analytics, including information about the pros and cons of each method. Finally, we’ll offer some general tips on how to set up whoever you choose to operate your marketing analytics to do the best job possible.

Internal Assignment

The quickest way to find an operator for your marketing analytics platforms is to choose someone on your existing team to take the role. Even if your organization already has a well-defined marketing department that manages its own tools, this step can come with some challenges. What if it’s a new system with which no one has training? If they have the expertise, does your internal marketing team have the bandwidth to take on the responsibility of another platform?

This path gets even trickier for early-stage companies that don’t have someone designated to oversee these types of tools. These super-lean organizations typically have to assign the role to someone who already has a lot on their plate, which brings up the potential for errors or incomplete data.

If you plan to go this route, ensure the internal team member has the necessary availability and knowledge. Otherwise, this option should be a short-term choice that you transition out of immediately – for example, having a marketing manager run an analytics platform until you can transition the responsibilities into a more-fitting candidate.

Hiring a New Team Member

This is ideal if all circumstances allow it. Adding someone to your team specifically to manage one or more analytics platforms is an excellent way to have a dedicated resource on this task, ensuring that it never slips to the bottom of the list of an employee with more generalized skills.

Of course, the challenge with this method is it requires the largest investment of time and money. Giving a task to an existing team member can be done instantly, and you can quickly start most external marketing resources if there’s an urgent need. Hiring a new person, though will take weeks, if not months, from start to finish. Even when you’ve completed the hiring process, there’s still a ramp-up time while the employee gets comfortable and fully acclimates to the new responsibilities.

On the other hand, if you don’t need someone immediately and have the capital available to support a dedicated team member, this might be the best choice. This is especially true if you’re looking for someone to manage a marketing system you use frequently. Choosing this option also gives you the most control over how you operate your marketing analytics.

Even when you’ve completed the hiring process, there’s still a ramp-up time while the employee gets comfortable and fully acclimates to the new responsibilities. Share on X

Using an External Resource

This choice typically involves initiating a working relationship with an agency or contractor (or both, depending on the complexity of your needs). In the best cases, an external resource should be a middle ground between assigning marketing management roles to poorly-qualified or overworked existing team members and hiring someone new.

This option still has a process that requires screening, and you may interview contractors or agencies the same way you might interview a full-time team member. The big difference here is cost – except for the most high-end, premier operators in the field, you can usually bring on an external resource for a fraction of the cost of hiring a new team member.

It’s also a quicker process to get them started, and there’s no long-term commitment required when hiring a dedicated team. Additionally, it’s much easier to scale workloads up and down when you use an external resource. This is great for seasonal businesses that may need a lot of work for a few months of the year but don’t have the demand for marketing analytics management to sustain a full-time team member year-round.

The drawback of using an external resource is that you’ll still need to devote time to managing and directing them, especially at the beginning stages. You’ll also have less control over how they work – in fact, legal standards dictate that you cannot provide specific requirements for when, where, and how work gets done when you hire a contractor. Some agencies or contractors spread particularly thin may not communicate the way you’d prefer.

Setting Up Any Type of Marketing Analytics Operator for Success

None of these three options is the right or wrong answer. Many companies have used all three approaches for marketing operators – some larger companies may even need to apply all three simultaneously.

Whichever source you decide on for your marketing analytics operator, you can do a few things to help them do the best possible job they can:

  • Be descriptive. This applies to everything from the initial job description you use to hire to the ongoing instructions you provide on new projects. Use quantitative, specific language when discussing skills, responsibilities, project timelines, and everything else you discuss with your analytics operator.
  • Communicate. In the era of remote work, it’s imperative to ensure the lines of communication between you and your team members stay open. You should be proactive about getting in touch and asking if they have any questions or obstacles – particularly when they’re new in the role and still getting settled.
  • Allow them to have input. Very few people want to be in a position with completely rigid instructions and no room for personalization. Autonomy is particularly important for employees of your company, who will want to incorporate their own unique skills and interests into their day-to-day role

The Last Word on Finding a Skilled Marketing Analytics Operator

It doesn’t matter how many resources you invest in the right tools for marketing analytics. If you don’t have the right person or people at the helm of the operation, you will eventually be disappointed in your ROI. On the other hand, bringing on the right talent – even if it’s a freelancer or someone you already have on the team – can help you maximize your return on investment in marketing analytics, even if your tools are limited.

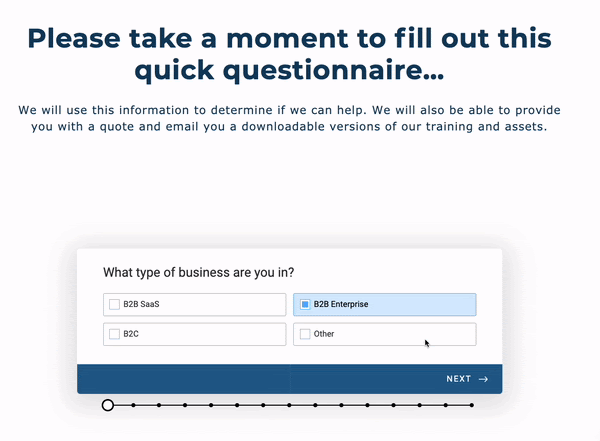
Interested in working with our team of B2B marketing funnel specialists? Just fill out this short quiz to see if you’d be a good fit for FunnelEnvy. We can help you optimize how you approach marketing analytics so that it’s much easier for anyone – individual or agency – to achieve the desired results.

By |2022-09-05T04:58:29-07:00September 19th, 2022|Analytics, A/B Testing|0 Comments

The Top 4 A/B Tests That Will Drive Revenue

Experimentation is at the heart of digital marketing success in almost any area, from paid advertising to content production. Marketers are constantly pushing the envelope to innovate in a way that brings measurable results to their organizations.

Modern marketing technology allows us to run experiments on many areas, from buying behaviors and customer preferences to information delivery techniques and specific advertising messages. A/B testing, or split testing, has been used for decades to improve customer satisfaction in B2C businesses. In the last few decades, technology has allowed B2B marketers to run powerful, sophisticated experiments leveraging analytics and machine learning. By some measures, more than half of all B2B marketers today use A/B testing as their primary conversion rate optimization (CRO) method.

On a basic level, many organizations could improve their websites and drive more customers to their products and services by using A/B testing to identify what works and doesn’t. However, with so many tests available to run, knowing which ones will give you the best return on investment (ROI) can be difficult.

We’ve compiled a list of the top four A/B tests for B2B marketers that can directly impact ROI through increased conversion rates.

Form Names and Text

You’ll likely use forms in conversion elements at every point in a funnel. The names of your forms and the text within them can impact conversions more than you may think. A/B testing can help you determine which form of words and text are most effective in getting people to convert. Try testing different fonts and header placements to see if any are more effective than others. You could also switch up the order of fields to see if visitors prefer to fill out one before the other.

This small change can make a big difference in your conversion rate. Remember not to change any form fields for existing clients or customers so drastically that people who already have an account with you are redirected back to fill out their information again. Also, remember that less is more: asking too many questions might scare away potential customers. On the other hand, adding new elements to a form may show visitors that you really understand their particular issues, pushing them closer to converting.

Element Colors

Different hues can evoke different emotions in your website visitors, which impacts how users interact with your website or app. Try different combinations of colors and see which ones result in the most conversions. According to researchers, blue is often associated with calming safety and trustworthiness, while red is associated with urgency and excitement. Green is typically associated with nature and growth.

You want your funnel pages to be visually appealing to potential customers, but you don’t want to go overboard. You can turn them away with too many bright colors or combinations that clash. A/B testing can help you find the perfect balance of colors for your website. A few specific areas to test different color combinations include background, text, button, and form field colors.

Also, remember not to go overboard on changes in a single experiment. Try to test just one color against another (e.g., red vs. green) by changing just one element at a time to measure each change’s effect on your conversion rates.

CTA Language

Asking your visitors to take action correctly can differentiate between a successful conversion and a bounced visitor. But what words should you use in your call-to-action? That’s where A/B testing comes in. Marketers can try out different phrases and see which ones get the best results. 

Generally, you shouldn’t overuse generic terms like “Click here!” or “Go.” Visitors are more likely to convert when they know exactly what you’re asking them to do. Ensure your CTAs include clear directions about what will be on the other side to avoid confusion and frustration over unmet expectations.

Emphasizing the benefits of your product or service in your CTA can be another powerful way to increase conversions. People are always more likely to take action if they know what’s in it for them. For example, if you’re promoting a case study that shows how your accounting software streamlines a firm’s operations, instead of using “Download the case study,” try something like “See how [Client A] saved 30% on staffing costs.”

Images

Though it’s something of a cliche by now, when it comes to conversion rate optimization, a good picture really can be worth a thousand words. A/B testing can help to find the perfect image for your funnel. One way to A/B test images is to divide them into categories, then test pictures in each category against one another.

For example, you might choose categories like:

  • People
  • Faces
  • Landscapes
  • Abstract

After that decision, you can test images of the same category, then compare how images in different categories perform. This is just one option – the specific level of detail you want to A/B test with your images will depend on how many visuals you have and the nature of its placement in the funnel. In other words: you may not need to A/B test every image you send out in your weekly newsletter, but you might want to be more thorough when it comes to testing the one image you include on a critical landing page in your funnel.

One way to A/B test images is to divide them into categories, then test pictures in each category against one another. Share on X

A Final Note on A/B Testing

Though A/B testing is undoubtedly popular and can be effective, it comes with its own drawbacks and dangers. As we’ve covered previously, you shouldn’t consider A/B testing as a panacea that will fix all the issues with your campaign. We’ve worked with many clients who gathered little to no valuable data from A/B tests, despite waiting many weeks or months to collect data. A/B testing can also be difficult for newer ventures that haven’t yet had enough time to build up a sufficient traffic baseline to be statistically significant.

That’s why we suggest using A/B testing strategically as a supplement to your CRO efforts. We believe that for modern B2B marketers to achieve the greatest success from A/B tests, it’s essential to move past “experimentation 1.0.” Marketers should consider their customer’s holistic journey and optimize each stage in concert with one another, using personalized insights and data about their preferences and habits whenever possible.

Are you looking for some assistance with integrating A/B testing into your funnel? Maybe you’ve already been running A/B tests for a while and haven’t seen the definitive data you were hoping for to direct your campaigns going forward. FunnelEnvy specializes in helping all types of B2B clients make A/B testing and other CRO experiments much more effective through the use of personalized solutions custom-built for a specific audience of sophisticated decision-makers.

Want to learn more about our services? Click here to fill out a short quiz that will help determine if we’d be a good fit to work together.

By |2022-08-10T18:04:29-07:00August 22nd, 2022|Analytics, A/B Testing|0 Comments

Know Your Numbers: The Top Metrics for B2B Inbound Marketing

Numbers are key in any kind of marketing. While some people may want to operate their campaigns using a preferred method or channel, only actual data can show whether or not decisions are successful. 

Unfortunately, there’s a lot of confusion among marketers today about what numbers are the most important to track. The huge expansion of the marketing technology sphere over the last decade has led to the creation of all kinds of statistics that may or may not be relevant to your business.

A handful of metrics should matter most for B2B marketers, though. The data you generate from tracking the below numbers will provide the most insight into your marketing efforts and how well they’re performing.

Qualified Leads

A qualified lead is someone vetted as a valid potential customer. Generally speaking, there are two levels of leads generated by marketing activity:

  • Marketing qualified leads (MQLs) are prospective customers who have shown some interest in your online marketing. Here, the most common examples include someone signing up for your email newsletter or filling out a form to download a longer lead magnet such as an eBook or white paper.
  • Sales qualified leads (SQLs) are the next step beyond an MQL. An SQL is vetted by someone on either the marketing or sales team as a legitimate prospect that is able to purchase what your company is offering. For example, a lead who has exchanged a few emails with someone at your company might be qualified to move from an MQL to an SQL.

To qualify leads, you can refer back to the classic BANT framework: Budget, Authority, Need, and Timeline. If you’re using the BANT formula to qualify a lead, make sure you apply it to the specific person with whom you’re dealing. Just because the company you’re talking to has a need for your offering and can afford it doesn’t mean your contact has the authority to seal the deal.

If you’re using the BANT formula to qualify a lead, make sure you apply it to the specific person with whom you’re dealing. Share on X

Pipeline Size

The size of your pipeline is defined as the number of active deals you have going on at any given time, in any stage of the sales process – from the newest leads to that one major deal your team has been working on for weeks. Your pipeline size is a dollar amount that adds up the total value of all the potential business you might be able to win in the short and mid-term future. Don’t forget to include existing clients that make repeat purchases every month or quarter – though it’s important not to rely too heavily on this type of business.

Knowing your pipeline size can help for a few reasons. First, it enables you to understand whether or not you’re doing enough marketing. A too-small pipeline could indicate that the marketing you’re creating isn’t compelling enough to generate interest in your product or service. How big should your pipeline be? You will hear anecdotal advice and rules of thumb ranging anywhere from 1.5 to 5 times your sales targets. The truth is that your pipeline goals will vary dramatically depending on what you’re selling. It’s impossible to create a one-size-fits-all ratio – instead, you should experiment and see what pipeline size to sales ratio strikes the best balance between growth and overwhelm for your team. 

Another helpful pipeline-related metric to track is your pipeline velocity. To calculate your pipeline velocity, multiply your number of deals by average deal size by win percentage, then divide the resulting number by the number of days in your sales cycle.

Metrics for marketing

Source: HubSpot

Your sales pipeline velocity tells you how many deals you are closing and how much revenue is moving through the pipeline each day. A higher velocity is obviously better. If your velocity isn’t where you want it, consider the factors slowing down deals from closing.

Meetings Set

Meetings are an essential part of sales metrics because they represent a significant transition point in the customer journey. To use an analogy from the dating world: it’s like going from having someone’s phone number and exchanging a few texts or phone calls to meeting up with them in real life. Things may or may not work out, but taking that step represents a level of commitment that doesn’t happen with everyone.

Meetings help you understand how often your people are getting in front of qualified customers. Tracking your meetings to leads ratio can help you identify the quality of your leads. If you’re getting lots of engagement with your marketing materials but aren’t setting that many meetings, it could be an issue with the kind of people you’re attracting. On the other hand, if you’re scheduling several meetings, but they aren’t resulting in closed business, it may be a good time to revisit some of your sales processes or refresh your team on best practices.

Customer Acquisition Cost

Customer acquisition cost (or CAC) is a relatively simple metric, but it can reveal a lot about your sales and marketing processes. To calculate your CAC, simply divide the total amount of money spent on all marketing activities by the number of clients generated. For a simple example, if your annual marketing budget is $100,000 and you were able to bring in 200 new customers from that marketing, your CAC is $500. 

Once you’ve determined your CAC, an easy way to evaluate the efficiency of your marketing is to compare it to your average customer lifetime value (LTV). Without knowing your LTV, it’s challenging to understand whether or not your CAC is where you want it. Continuing the example above: if an average customer will spend $1,250 with the company, a $500 CAC is excellent. That means you’re getting back roughly $2.50 in revenue for every $1 spent acquiring a customer.

On the other hand, say your LTV is only $250. Then, you have a problem because you’re spending $1 to bring $0.50 worth of business. Again, this is a straightforward example with round numbers for easy calculation. Still, these numbers will help you understand how to apply your CAC within the broader context of your marketing operations.    

Conclusion: Only Trust the [Right] Numbers

One thing we aren’t lacking in digital marketing is beliefs on how things should be done. It’s easy to sit around and theorize or talk about what we think might work for B2B marketing.

But the reality is that metrics are the only way to know which ideas are genuinely effective and which are just nice theories to talk about in meetings. Every company will have a slightly different perspective on where their numbers should be and what they should be looking for as they review marketing data. When it comes to metrics, remember to pick the right numbers to track and follow them consistently to gain a comprehensive picture of your marketing and its effectiveness.

Do you need some help filtering through all the marketing data you have to identify what matters? Or maybe you aren’t even sure where to start collecting data and want guidance from a specialist. Fill out this short quiz to learn more about how the conversion rate optimization experts at FunnelEnvy may be able to help.

By |2022-04-05T04:19:03-07:00April 18th, 2022|Analytics|0 Comments

Getting the Most Out of Paid Media Spend in 2022

For marketers looking to reach a specific audience quickly, few methods can achieve results like paid advertising. By the year 2023, video ad spending on social networks in the U.S. is projected to surpass $28 billion, according to HootSuite. Platforms like Facebook, Instagram, and YouTube are considered supremely valuable by corporate marketers looking to quickly get in front of the right people – even if they haven’t addressed that audience previously. Paid ads have also been a boon for small local businesses, targeting their campaigns only within a given geographic region.

However, marketers have seen the price of ads on major social platforms – particularly Facebook and Instagram – increase in recent years. Part of this is a result of the pandemic of 2020, which caused an initial reduction in paid media prices due to reduced spending that later corrected after advertisers realized the new importance of digital reach. Additional pressure on Facebook ads has come as a result of high-profile moves by Apple to restrict tracking and cookies on its devices, a shift popular with many consumers but problematic for advertisers and their networks. Executives at Meta said Apple’s privacy changes alone could cost the company $10 billion in revenue.

The increased competitiveness in the world of paid ads is why it’s more important than ever before to maximize return on ad spend (ROAS). We’ll cover some tips to optimize your paid media lead generation campaigns in this post.

Evaluate the Conversion Experience First

When looking to improve the performance of their paid ads, many marketers make the mistake of bringing in more leads. But in many cases, a higher quantity of traffic doesn’t always translate to a higher quantity of leads. Even if it does, that doesn’t always mean the leads will be of good quality. 

Before you dump more ad money into reaching a wider audience, consider the elements of the conversion experience at every step of the campaign. This includes:

  • Form fields
  • Button design and placement
  • Form and button copy
  • Multimedia elements
  • Social proof 

Even the smallest tweak might have an unexpectedly large impact on your conversion rate. Remember to perform proper A/B testing on each of these elements so that you can use accurate and relevant data to understand what your audience wants.

Before you dump more ad money into reaching a wider audience, consider the elements of the conversion experience at every step of the campaign. Share on X

Use Closed-Loop Analytics

Another common mistake we see made by marketers is evaluating prospects’ actions in a vacuum. They think only about how someone engages with one specific set of social media or video advertisements. The problem with this approach is it ignores all of the other behaviors in different parts of their customer journey. This data is ripe to be used in the creation of more effective marketing. Gaining a full picture of prospect behavior is especially important in the B2B space, where buyers have many different agendas and priorities to consider as they evaluate purchasing options. 

To avoid this shallow view of the prospect, it’s important to “close the loop” with your marketing. That means you should integrate all the tools you use in your marketing to share data – even if they aren’t directly involved in the campaign where this data is being applied.

We believe Google Analytics is one of the most powerful tools for digital marketing because of its universal nature. It may not be as sophisticated as newer tools, but it’s compatible with so many different kinds of marketing tech that it can be a valuable foundation for your stack. It’s also reliable – there’s no concern about the company folding overnight and leaving clients high and dry.

For best results, consider going beyond just linking Google Analytics to your marketing tools and connecting everything you possibly can, from your eCommerce platforms to your CRM, your website CMS, and other tools. It won’t be possible to integrate everything, but the more data you can share, the better you’ll be able to calibrate paid media and other marketing campaigns.

Remember, closing the loop isn’t always just about data. Bringing together your sales and marketing teams to compare notes on what does and doesn’t work is a great way to ensure that your company’s approach to business development isn’t being harmed by the “silo” effect – where different departments don’t communicate. The collective efforts of sales and marketing teams looking to improve the selling process are sometimes referred to as sales enablement. For more on sales enablement, check out this helpful guide from HubSpot.

Test Ad Creative

One of the final considerations for maximizing your paid media spend is ad creative. We typically advise our clients to consider other elements of their campaigns first, especially if the creative in question has been successful in the past. But if you’ve looked elsewhere and felt that the ad could use a refresh, changing its visual elements and text may be a wise choice.

The ad’s creative elements are particularly easy to evaluate through A/B testing. It’s relatively simple to break down the ad into different components, change each one, and see which one offers the most impact. The typical elements of a paid ad include a main image, some ad copy, a headline, and a call-to-action button. Check out the below example from Shopify:

Paid media spend

In this example, elements you might evaluate through A/B testing include the text (currently describing Google algorithm updates), the button CTA, the image, and the title next to the button. Isolating each of these elements could help you determine which version works the best. Until you’ve run experiments on each different part of the ad, it’s impossible to tell what needs to be improved and what should stay the same for optimal performance. You may not need to perform testing this extensively for every ad in your campaign, but it can help troubleshoot those that fail to perform or see performance levels drop off significantly.

Final Thoughts on Optimizing Paid Media in 2022

One of the big challenges of paid advertising for B2B companies is the nature of the transaction. Business purchases tend to be larger, more complex, and take more time to evaluate than a consumer buying something for personal use at home. B2B buyers often don’t have sole authority the way consumers do, and many are naturally suspicious of companies that use traditional sales tactics or ad campaigns with promises that seem too good to be true.

That doesn’t mean paid ad campaigns can’t be effective for B2B marketers, though. You can still attract people to your brand by promoting informative content assets or other tools that provide actual value to your audience. The advertising landscape is more competitive than ever before, which is why it’s vital to maximize the dollars invested into paid placements. By fine-tuning your conversion experience, sharing data, and thoroughly A/B testing, you can give your business a much better chance at using paid media to bring in leads that will drive the continued growth of the organization.

By |2022-03-09T10:26:47-08:00March 21st, 2022|Analytics|0 Comments

Optimizing Campaigns & Websites by Integrating Offline Conversions into Google Analytics

Integrating offline conversions into Google Analytics can help you optimize your campaigns and website experiences. This is something that we commonly do for our customers when we’re optimizing their inbound funnels. In this post I’m going to go into some of the details about how it actually works.

So, what do I mean by offline conversions? If you’re doing demand or lead generation you’re capturing those leads onsite, typically through a form or a chatbot. As you know that’s only a small part of the much larger funnel, most of which happens offline. Your Marketing Qualified Leads, Sales Qualified Leads, opportunity stages, closed won revenue. Those are all captured offline – and can think of them as offline goal conversions.

In addition to being offline, you also have the distinction, if you’re in B2B, of having individual offline conversions, like qualified leads versus account or company level conversions, like opportunities or revenue.

demand generation funnel

This can also exist in the e-commerce world, especially if you’re in B2B. You might be selling products on your site but also have volume based quote functionality where larger buyers are initiating quotes online and the quote generation and order capture is actually taking place offline.

The biggest optimization mistake that we have seen over the years is using the wrong success metric. And if you’re only measuring online goals, clicks and leads, that can lead to inefficient spend in your paid media campaigns and wasted activity and low quality leads from your website experimentation and optimization.

A solution on the paid media side is ultimately being able to adjust your bids based on those offline conversions. And for your website, assessing the results of experiments and making decisions based on those down funnel conversions.

channel optimization

Google Analytics is often the source of this analysis and decision making. By default Google Analytics is only tracking individual onsite activity. How traffic gets to the site, the bounce rates, page views, etc. Even the goal conversions typically stop at the form completion (on-site).

Google Analytics is great at digesting paid media campaign information website activity, and linking to ad platforms like Google Ads. But the majority of your offline conversion information is happening in different systems. Marketing automation platforms, CRM, or maybe a quote and order management solution.

To solve this we need to integrate those directly into Google Analytics. By doing so we can actually see those offline conversions, like marketing, qualified leads, opportunities, revenue as goals directly in Google Analytics and even evaluate the performance of campaigns, channels, landing pages, everything else in Google Analytics by down funnel goals like closed won revenue.

Backend integration to GA

offline goals in GA 2022-02-07

So here are the main requirements to accomplish this integration:

  1. Understand the important identifiers that Google Analytics uses and store them in your backend platforms.
  2. Capture those offline conversions from those backend systems.
  3. Translating them into the identities and events that Google Analytics expects.
  4. Send hits to Google Analytics via the offline API known as the Measurement Protocol.

full GA integration

Let’s start by understanding the identifiers that Google Analytics uses.

Here, I’m going focus on Universal Analytics. GA4 (Google Analytics 4) is still being rolled out as at the time of this post. A lot of the concepts in GA4 are very different. So we’re still very focused on Universal Analytics.

First off, Universal Analytics has a Tracking ID. This identifies the account and property that you’re going to be sending hits to. If you log into the Google Analytics interface, you’ll be able to see that Tracking ID. You can also retrieve it using JavaScript from the browser.

The second identifier that we care about is the Client ID. This identifies a device or browser. It’s automatically set by the Google Analytics script, persisted in a cookie on the browser and has a predefined structure.

GA tracking id client id

The final identifier is the User ID. This is less commonly used in these use cases. But it is important to understand because this lets you identify an individual user on the site. Unlike the prior two IDs, this is actually set by a site owner, typically post authentication, where the user might be logging in with multiple devices, to identify an individual user and as such it has no predefined structure.

Importantly, when you send offline hits to Google Analytics, you need to include the Tracking ID and either the Client ID or the User ID. So the approach that we’re going to take is to store these identifiers alongside the lead in your backend solution.

And really, there are two options here. If you only care about individual goals and you only care about the Google Analytics tracking, you can store that Google Analytics Tracking ID and Client ID directly in your backend platform.

The second option, which we use at FunnelEnvy and gives us a little bit more flexibility across different implementations and other identifiers that we have to track is to actually capture those GA identifiers, the Tracking ID and Client ID in the browser, and associate them with another Visitor ID that we set as a cookie. Then we store that single ID, that Visitor ID in the backend platform and translate it when we’re setting those hits to GA.

To actually send them to the backend platform, you can populate the IDs that you’re going to use as hidden input fields on the form. When the lead submits that form, the GA identifiers will be saved in your backend platform.

This is relatively straight forward to do in platforms like Salesforce, Marketo or HubSpot, in which you can create custom fields or properties in that backend platform. And then populate with hidden fields in the forms using JavaScript. We commonly do this using Google Tag Manager.

storing GA identifiers in backend

The second step then is capturing the offline conversions that are happening in those backend platforms. The first thing you have to do is identify the offline goals that you care about. If you’re doing demand generation, it’s typically marketing, qualified leads or sales qualified leads at an individual level.

New opportunities closed won revenue, are very common, and if you’re generating offline orders, the generation of the quote or the order itself.

The most common way that we actually capture these offline conversions is triggering a webhook from the source platform for each offline conversion. A webhook is simply an HTTP request that’s made to our system.

Again, these webhooks will have to include the Google Analytics IDs that you’re storing on the backend, or the visitor ID, if you’re taking that approach. And importantly, where you do have an amount, like an opportunity value, a closed won value, an order value, you want to include that because you’ll be able to send that as well to Google Analytics in either the event or order that you’ll be submitting.

Now you can configure webhooks very simply in a variety of these solutions. HubSpot has workflows with webhooks, Marketo natively supports webhooks. In Salesforce, you can code webhooks in Apex or use an application like the Hooked app to visually create workflows and webhooks. Now for some reason you can’t create a webhook as an alternative you can poll through the API or directly from a database.

webhook options hubspot, marketo, salesforce

Once you’ve captured the offline conversions, you’re going toto translate those into the format and the identities that Google Analytics understands. If you’re storing the Google Analytics Tracking ID and Client ID directly in the backend, and you only care about those individual goal conversions, that you don’t really need to do any identity translation. The identity is encapsulated within that Tracking ID and Client ID.

If, however, you are storing the visitor ID then you’ll translate that into the relevant Google Analytics IDs. And if you are tracking account level goals, like opportunities, deals, or revenue at an account level, then you’re going to need to translate your account to all of the contacts that you have available. To do this you’re probably going to need to pull some kind of account to contact mapping from your CRM.

The following diagram illustrates this. For an individual goal, like MQL, you can web hook that directly from the CRM into Google Analytics. Just get the Tracking ID and Client ID and send that on a one-to-one basis to Google Analytics. But if you are sending an account level goal, there’s another step involved of pulling the account to contact or individual mapping, then translating account identifiers into contact IDs, and then into Google Analytics Tracking IDs so that you can send those offline hits to Google Analytics.

individual vs account goals

What you’re really going to want to do is identify all of those offline conversions and then map those to the types of hits that you’ll be sending to Google Analytics through the Measurement Protocol. You’ll want to identify the type, whether that’s account or individual.

Typically for demand generation type of scenarios we use events as the hit type whereas for e-commerce we use orders. As part of this mapping you can identify the relevant fields in those hits and make sure you’re accounting for all of them, including the value, which can be either an actual value coming from the offline conversion or predicted value if you can do that.

map offline conversions

The final step is actually sending those hits to Google Analytics. So for this again, we’re going to use the Google Analytics Measurement Protocol. This is an offline API to be able to send hits directly to the GA servers over HTTP. Now Google Analytics includes a pretty helpful tool that allows you to build and test those offline Measurement Protocol hits.

measurement protocol hit builder examples

So here you can see an example of an event and the event structure that’s sent to Google Analytics. As well as an enhanced e-commerce purchase example that you might use for an offline e-commerce order.

If you are sending event hits, then you’ll want to create a goal of type event so that the goal is triggered on the offline event hit that you’re sending to GA. And if you are sending an event value along with that measurement protocol hit, you’ll want to set the goal value as the event value.

GA goal setup

Unfortunately the measurement protocol has been abused over the years by bots. In the view settings Google Analytics has the ability to block bots. We’ve seen that if you leave the IP address blank, and don’t set an IP address on that Measurement Protocol hit you’re more likely to get that traffic blocked as bot traffic. So we typically recommend setting the IP address of the hit to the same visitor IP that initiated the prior session (that submitted the form), and send that along with your Measurement Protocol hit.

The other thing that you can do that’s really helpful is set a custom dimension along with those measurement protocol hits. One example is to send the buyer stage. So if the visitor is an MQL, if they have an active opportunity, send that as along as a dimension to Google Analytics so you can further segment that traffic and understand what they’re doing on site.

And then finally you can backdate hits, but only up to four hours reliably using the queue time parameter. What that practically means is you can’t expect to send hits days or weeks in the past, you need to be pretty on top of it and this process needs to be running relatively frequently because you can really only backdate those hits by four hours.

I want to spend a little bit of time talking about attribution. By default, the measurement protocol hits that are going to be sent are, will attributed to the direct channel in a new session. The default reporting in Google Analytics uses the last click non-direct attribution model for reporting.

Practically, what that means is that when that conversion comes over offline from the Measurement Protocol, it’s going to be in a new session. But the conversion will actually be attributed to the prior non-direct channel.

So to visualize this that let’s say we have a visitor coming along, hitting the site, viewing a few pages and then submitting a form, and that visitor came in from a paid search ad. When we send over the offline conversion, that’s going to generate a new session which by default it will be attributed to the direct channel. So the conversion is actually going to be attributed to the prior session’s (paid search).

offline conversion attribution in GA

I want to wrap this up with some final thoughts. To be able to track these offline conversions and associate them to marketing campaigns, as well as website experience, you don’t need an entirely new tech stack. You can use Google Analytics in the same way that you have. You just have to integrate the data into it.

As I mentioned the number one mistake that we see when doing optimization of any kind is picking the wrong success metric. And without measuring these meaningful outcomes, optimization experimentation, things like segmentation and personalization are really just vanity exercises.

With these offline conversions, however, you can optimize your bidding through your ad platform, for example, by linking Google Analytics and Google Ads and triggering goal conversions that occur from offline events. And you can optimize your experiences, most importantly, your offers and your form experiences that are most likely to have an impact on those down funnel KPIs.

Finally, if you do have a long sales cycle and a relatively low volume of revenue conversions, you can take this a step further. You can actually take a more frequent, upstream conversion and use a predictive model to predict revenue and optimize faster. As we see from the table below, more frequent conversions (a higher number of conversions in a certain time period), in Google Ads will actually allow the algorithm to optimize faster. So sending along a predicted revenue value with your MQLs can allow that algorithm to optimize traffic much faster, while those down-funnel actual closed won revenue conversions are coming in.

google ads impact of conversion volume

By |2024-12-19T04:02:43-08:00February 7th, 2022|Analytics, The Funnel, B2B|0 Comments

Customer Journey Analytics Optimizes Demand Generation Marketing

To do it successfully, you need visibility into every step of your customers’ journeys and the means to track and analyze their data to understand what motivates them now and in the future. But how do you do that? Fortunately, customer journey analytics provides valuable insights into your visitors’ behavioral patterns and preferences throughout their entire customer journey. These insights allow you to create enhanced customer experiences that motivate visitors to reach the endpoint in your sales funnel.

What exactly is customer journey analytics, and how can you use it to optimize your lead generation marketing strategies? Let’s find out.

What Is Customer Journey Analytics?

As the name suggests, customer journey analytics is an application that explicitly analyzes customer journeys. This application involves tracking and analyzing the way your customers use various channels to interact with your brand. It analyzes all channels — used currently and in the future — that your customers touch directly.

These channels could include:

  • Channels with human interaction, such as call centers
  • Two-way interaction channels, such as display advertising
  • Channels that are fully automated, such as mobile devices or websites
  • Third-party operated channels, such as independent retail stores
  • Channels that offer live customer assistance, such as joint site navigation or live chat

Why Do I Need Customer Journey Analytics?

Even as customers’ journeys have grown increasingly complex, today’s customers expect their business interactions with your brand — across multiple channels — to be on par with CX leaders such as Amazon and Google. If your customers’ journeys aren’t seamless every step of the way, they will become dissatisfied and quickly move on to a competitor. Conversely, studies show that positive customer experiences drive revenue growth.

Studies also show that investment in customer feedback management isn’t enough to improve your CX levels. This failure is attributed to the fact that feedback is generally only requested at points along the journey. Unfortunately, this means that only some of the customer journey is captured, misrepresenting your customers’ overall experiences.

This incomplete data reduces your ability to gain a complete picture and accurate insights into your marketing strategy performance. It also leaves you at a disadvantage for enhancing customers’ experiences and tying customer experiences to tangible business outcomes.

Customer journey analytics is the bridge between your customers’ behaviors and your business outcomes. A customer journey analytics program enables your business to track, measure and improve customer experiences across several touchpoints and time periods, encompassing the entire customer journey.

Leveraging customer journey analytics enables demand generation marketing leaders to answer complex questions, such as:

  1. What causes our customers’ behaviors?
  2. What past interactions or journeys have our customers undertaken that led them here?
  3. What paths do our customers take on their journeys?
  4. What are the most likely outcomes for each customer or journey?
  5. How will these journeys and outcomes impact our business outcomes?
  6. What are our customers’ goals?
  7. How do their goals align with our business goals?
  8. How do we add value for each customer and enhance their customer experience?

What Are the Benefits of Customer Journey Analytics?

Customer journey analytics is a vital ingredient in an effective customer journey management program. It is the piece that analyzes comprehensive data and generates actionable insights. The insights gained from this type of customer management program are valuable for both customers and businesses alike. Here’s how.

Optimized Customer Experiences

The insights gained through effective analyses of your customers’ journeys enable you to optimize each step along the way for a seamless overall experience.

Ongoing Measurable Performance Results

In addition, ongoing analytics allow you to continuously measure demand generation marketing initiatives’ performance across multiple channels and define the appropriate KPIs to measure each journey.

Data Analyses From Numerous Channels and Timeframes

When you look at customers’ journeys across several channels and timeframes, authentic pain points become evident. Identifying these pain points enables you to take action and positively impact your customers’ journeys.

How Can I Optimize Customer Journey Analytics?

Customer journey analytics is typically optimized by leaders in customer service, analytics, marketing and CX. These leaders adopt customer journey analytics platforms to improve their demand generation marketing strategies and performance measurement capabilities.

These teams optimize customer journey analytics to:

  • Amass customer journey data
  • Resolve multi-channel customer identities
  • Analyze innumerable interactions throughout countless cross-channel journeys
  • Identify CX pain points and their root causes
  • Verify potential customer journey enhancements
  • Quantify CX investments’ ROI

Customer Journey Mapping vs. Customer Journey Analytics

As a demand generation marketer, you may already implement customer journey mapping and feel that it provides the same insights as customer journey analytics. Unfortunately, this is not the case. While journey mapping focuses on qualitative insights, customer journey analytics is more quantitative and incorporates a much larger scope.

Static Snapshots vs. Continuous Detail

Journey mapping provides only static snapshots of some of your customers’ journeys and lacks the required detail to represent the multitude of your customers and their unique behaviors.

Static vs. Time-Based Data

Customer journey analytics is driven by time-based data, allowing you to see how customers’ journeys change over time. The ability to continuously measure complex multi-channel customer journeys and touchpoints along journeys help marketers predict customer journey successes.

Trial and Error vs. Real-Time Testing

Without visibility to up-to-date data on each interaction along the customer journey, businesses are left to experiment with new enhancements on the entire customer journey. Not only does this potentially waste time and resources, it means marketers will be waiting for aggregated results that don’t pinpoint where the issues are.

Customer journey analytics provides marketers with the visibility to see how customers respond to improvements along several touchpoints and time periods. In addition, this application enables marketers to test and track the success of customer experience interaction improvements in real-time.

Powered by machine learning and AI, customer journey analytics enables marketers to identify pain points along the entire customer journey that negatively impact CX. These insights allow data-driven businesses to prioritize opportunities for customer journey optimization and drive revenue growth.

How To Improve Your Site Experience In A User-Centric World (And Still Generate Leads)

The algorithmic world of web optimization is rapidly moving towards a user-centric paradigm. To keep up, brands will need to prioritize their site experience like never before. 

In this post, we’re going to cover why site experience is key to your success and give you some actionable tips you can use to improve your site experience today. 

Let’s get into it!

Your site experience is key to generating leads

Website experience, or UX, encompasses everything your users encounter when they visit your website. It’s the visuals, the ease with which they can uncover information, and the process they go through to make a purchase. 

In a world that is becoming more user-centric, focusing on user privacy and moving away from keyword-based SEO, lead generation is going to become increasingly entangled with the performance of your website. The better your site experience, the more leads you’ll generate. And, with that in mind, here are our top ways to improve your site experience…

5 ways to improve your site experience

1. A great site experience starts with pages that load quickly

The first thing that anyone is going to notice when they visit your website is how quickly it loads. Or, ideally, they won’t notice this at all.

The goal for any website should be for any page on your site to load in less than three seconds on an average WiFi download speed. If your website takes longer than this to load, you have some work to do. When it comes to mobile, things need to be even faster. Less than two seconds is ideal for reducing your bounce rate. 

One of the first things you should do to reduce a web page’s load time is to compress all of the images on your website. There are free resources online (like TinyPNG) that will quickly compress images for you. 

Plus, white space is also important. Not only is it important to a pleasing design, but blank space loads faster than content-filled space. 

And, finally, ensure that the most important and visible elements of your webpage load first. Typically, buttons and navigation bars should appear first, then your text, then images and media. 

2. Simple and efficient registration and sign-up forms are crucial

Another crucial component of a great site experience is simple registration and sign-up forms. These are the forms on your website that visitors use to sign up for your newsletter, subscribe to your service, and register an account on your website. 

If these forms aren’t easy to use, then visitors aren’t going to use them. When you ask your visitors to complete a task, you aren’t just asking for their attention span, but also their mental effort. Seamlessness is key. 

A simple form process uses as few fields as possible, doesn’t needlessly violate the person’s privacy, and keeps everything on one page if possible. The more information a visitor has to give and the more pages that have to load for them to give, the more likely they are to bounce.

3. Have clear CTAs –– and not too many of them!

Everyone working in the marketing industry knows that CTAs dramatically increase engagement. Direct CTAs, such as “Order this product today!” as well as indirect CTAs like colorful buttons both count. They give a webpage purpose, guide visitors down a path, and most importantly, close sales!

Despite the overt marketing at work here, visitors like CTAs. They’re on your website because they are curious about your business. CTAs make their journey simple. Click here for this information, go here to buy this, and subscribe in these three steps. 

On the other hand, you can overdo your CTAs. Try to keep it to just one CTA per page, and don’t have every CTA be aimed at landing a sale. Maybe have a CTA to your newsletter on your blog instead of a CTA for a product you sell. Or, work on personalized CTAs (or smart CTAs) tailored to different audiences and their specific needs. 

And use clever design and logical flow when placing your CTAs. You don’t need a big red arrow telling visitors to look at your CTA if you place the CTA where they’re already looking. 

4. Follow conventions creatively over creatively ignoring them

A common pitfall that businesses run into is the idea that everything they do needs to be unique to them. So they overcompensate when doing something simple (like crafting a great site experience) and try to stand out by breaking convention.

This more often than not will scare visitors off. Design conventions exist for a reason –– because they work! And because conventions are popular practice, they’re what users expect when they visit your website. 

Moving the navigation bar to the bottom of the screen adjusting all of your text to the right, and having images of your product flash around the screen will help you stand out –– but probably not in the way that you hope for. 

Instead of trying to be quirky, stick to tried-and-true web design conventions. Then, put your personality into them! Follow traditional functional practices while adding unique and personalized aesthetics to your website. 

A pleasing color scheme and clever animation in an otherwise standard website will take you much farther than an obtuse (albeit original) site experience.

5. Save your writing for the blog

Our last tip is pretty simple. Save your writing for your blog! Articles and content marketing perform great there, but they’re not going to perform as well on your landing pages. 

Instead, try to replace text content on your home and landing pages with graphics, blurbs, and bullet-point lists. Video content performs particularly well on landing pages (not so much on your home page). Use text in short sentences to give clarity, flow, and concise information. For everything else, stick to visuals!

Eager to keep learning about how to improve your site experience?

The tips listed above are just a few of the ways that you can improve your site experience. To become a lead generating pro, you can check out the rest of the posts on the FunnelEnvy blog.

And if you’re ready to take your marketing and site performance to the next level, reach out to the FunnelEnvy team for expert advice, guidance, and optimization. 

By |2021-06-04T00:02:20-07:00June 2nd, 2021|Uncategorized, Conversion Rate Optimization, Analytics, Strategy, B2B, Experimentation|Comments Off on How To Improve Your Site Experience In A User-Centric World (And Still Generate Leads)

Website Analytics & Attribution in the Privacy Era

If you’re wondering how the new privacy landscape will affect your ability to track visitors and customers you’re not alone. In this conversation, we dig deep into the governmental, technology, and other considerations that marketers need to be aware of. Hopefully, we’ll clear up some confusion and misconceptions along the way!


By |2021-06-01T09:51:21-07:00May 27th, 2021|Uncategorized, Analytics, Testing, B2B|0 Comments

How Marketing Teams Should Optimize Website for Conversions that Align with B2B Sales

You might have heard before that marketing and sales can sometimes experience the business version of a sibling rivalry, but it’s not quite what you think.

Within business-to-business (B2B) organizations, marketing’s focus is on generating leads, while sales focuses on getting those leads to close. A disconnect happens when your marketing team (with good intentions) focuses on volume over quality, therefore resulting in passing over a high volume of leads to sales that just won’t close.

In this article, we’ll walk through a framework for how to categorize leads that come in through your website, how to build website messaging and landing pages that are consistent and relevant for each type of category, and how to optimize for intent as you go.

A General Framework for Categorizing Website Leads

It might seem obvious that your marketing team should focus on quality over quantity, or ideally both at the same time, but in practice the two can get a bit muddled.

We recommend generally categorizing leads into three different buckets:

  • High volume, high intent. These leads should be sent to sales and prioritized.
  • High quality, Low intent. These leads should be sent to a nurture funnel where they continue to be educated and engaged.
  • Low quality. These should get filtered out altogether, or directed to a different offer.

Ultimately, we’re talking about being more efficient with  qualification by allowing your website to do a lot of the work for you.

This includes building consistent messaging for each lead category, building and presenting relevant landing pages for those people, and optimizing for intent as you go.

Create Messaging that’s Consistent and Relevant

In order to qualify each website visitor as a member of one of the lead categories above, you’ll need to be able to automatically consider two things before displaying website content:

  • How that person got to your website. The messaging on the page they visit should be consistent with the email, ad, social posts, blog post content, or search result that preceded it.
  • Their business demographic. Use marketing automation, CRM and / or 3rd party data to ensure that messaging is also relevant to their business size or industry. Focus on the industries and business sizes that have an expected value for your sales teams, and send all others into the low quality bucket.

One effective way to do so is to display case studies from relevant industry competitors, if you have them available. 

For example, if someone from Wells Fargo visits your fintech website, they’ll likely respond more positively to a landing page with logos or success stories from Chase or Bank of America then from Investopedia or Stripe. If that’s not in the cards for you, focus on business size first. Before showing a Wells Fargo visitor logos from a fintech startup, show a success story from Macy’s, Delta, or another enterprise business.

This example from Shopify that’s optimized to attract businesses in e-commerce fashion. The logos and success stories listed on the page include e-commerce fashion brands, like AdoreMe, Cee Cee’s Closet and Coco and Breezy, immediately signaling to other fashion e-commerce companies that Shopify’s solution might be a good fit for them.

This example from Shopify that’s optimized to attract businesses in e-commerce fashion.

FunnelEnvy offers reverse IP, or account matching, and real time data integration to help marketers surface insights that allow them to display industry-specific webpages like these.

We also help companies display pages based on other types of data, like funnel stage, company size, and more.

This example from a large call center showcases how experimenting with personalized offers on their website by buyer segment led to an increase in qualified leads. 

This example from a large call center showcases how experimenting with personalized offers on their website by buyer segment led to an increase in qualified leads.

In fact, MQLs increased by 10X between March and June of 2020.

Graph showing MQLs increased by 10X

Landing pages that set the right expectations

Your landing pages essentially start the sales process by presenting your products to people for the first time. For them to be effective, they need to accomplish two things:

  • Mimic your sales people. This should be true for every lead category. Once a person converts through your website and makes it to the stage where they speak to sales, they shouldn’t receive an entirely different message than what led them to convert in the first place.
  • Clearly communicate what each site visitor should expect next. This will change depending on the lead category. If your site visitor is categorized as “high quality, high intent” and on their way to talking to a sales person, tell them that. If they’re getting redirected to a different offer or getting more information sent to their inbox, tell them that instead. 

One common mistake we see companies make is sending leads to a discovery meeting with a sales development representative (SDR) after they register for a demo. They’re expecting to see the product, when in fact, they end up in a frustrating meeting where they’re asked a lot of questions, afterwards which the real demo is scheduled depending on how they’ve qualified.

One way to rectify this is to make the discovery process part of the inbound flow, like we do at FunnelEnvy.

Our quick questionnaire helps us to categorize site visitors that convert so that we can set expectations for what will happen next, once they’ve completed the form.

Take a moment to fill out this questionnaire

Here’s another example that qualifies leads using company size and sales strategy:

Example that qualifies leads using company size and sales strategy

Optimizing for intent as you go

You’ve created messaging for each lead category and set up your landing pages so that the right expectations are set. Now it’s time to take it a step further by putting in place a mechanism to filter out low-quality leads or show them a different offer.

If a website visitor that’s not a highly valuable lead for your sales team comes along, you’ll want to be able to identify them with data that reveals their business size, industry, title, or any other identifying signal that makes a difference for you.

If someone comes along that doesn’t fall into any of the buckets you’ve identified as high value, consider sending them to your self-service solution (if one exists) or including a message upfront that right now, you’re just not the right fit for one another.

While it might seem scary to direct some leads away from sales, it can actually improve your sales team’s productivity and have a positive impact on revenue.

Working with FunnelEnvy, one startup increased their monthly marketing qualified leads (MQLs) by 30%, and grew revenue from closed or won deals by 250% the following quarter. Here’s what that success looks look over time:

One startup increased their monthly marketing qualified leads (MQLs) by 30%

This success came from optimizing their website to align with their B2B sales strategy, and by only surfacing high quality leads to their sales teams that were ready to buy.

Bonus: treat your high quality leads like gold

Those leads that are high quality and have the appropriate purchase intent should be treated like gold. 

To ensure that your sales team is successful, make sure there’s an established service-level agreement (SLA) on when and how sales is following up on those leads. For example, Marketo’s sales team commits to a 24-hour SLA.

If a tight 24-hour turnaround isn’t in the cards for you, automate your follow-up process with marketing automation or your customer resource management (CRM) software.

End the infamous sibling rivalry

The infamous sibling rivalry amongst marketing and sales isn’t actually a sibling rivalry at all — in fact, it only exists when these teams try to help one another in the wrong way.

Your website can do most of the heavy lifting to close this gap and help to qualify leads that are sent to sales automatically. 

If you’re looking for a custom solution to help personalize your website content for leads of different types, FunnelEnvy can help — contact us.

Optimize your Revenue Funnel by Focusing on the Offers

Let’s take a step inside the data-driven demand generation marketing team. The biggest concerns on the CMOs radar are that the acquisition costs are too high and not hitting their pipeline or revenue goals.  Now looking at the data, we know that not only are they spending a lot on paid and organic traffic, but the quality of the traffic is good, and it’s not converting.

So, of course, the next question would be – what can they do about it? A common answer is to focus on website conversion rate optimization, which involves running online experiments. That’s something you can put a budget around and prioritize but recognize that your executives are going to want to see impact based on pipeline and revenue and probably want to see it fast.

Online Experimentation

Back in 2017, the Harvard business review published an important article digging into the power of online experimentation. In it, they correlated successful business outcomes to a culture of experimentation. 

harvard business review article title

Image Source: The Surprising Power of Online Experiments (Harvard Business Review | Link)

The article cited examples like the one below from Bing,  who tested multiple different colors on their site, ran experiments. and realized an incremental $10 million in annual revenue from these experiments. 

small changes with huge image image harvard business review article

Image Source: The Surprising Power of Online Experiments (Harvard Business Review | Link)

Similarly, Google ran a test with 40 different shades of blue on their site. When they ran those experiments, they achieved $200 million in incremental revenue. Given these results, should we, as demand gen marketers, be running the same experiments?

In our opinion and experience, no, you should not.

You’re not Google or Bing. Leaving aside traffic considerations, you’re trying to influence B2B buyer behavior over customer journeys. And the reality is that groups of buyers that consider enterprise solutions are not going to buy based on the button color or other small cosmetic changes.

This is important because experimentation comes with a cost. Not only do you have people and the technology costs of running online experiments, but also your organizational ability to make decisions. So, focus on the elements that would deliver revenue and influence those B2B buyers when you’re thinking about experimentation.

When we think about the B2B buying journey or the revenue funnel it’s common to conceptualize it as a series of buyer stages. As prospects progress through those stages, they do so through exchanges, in which you’re offering something to that prospect in exchange for something else. The offer could be some content in exchange for their attention, an event, or an opportunity to speak to the sales team in exchange for their contact information. Ultimately those offers are how they learn more about your solution and how it would benefit them. 

funnelenvy funnel image

From our experience and the testing that we’ve done, the highest leverage use of experimentation for the demand gen org is to improve the relevance of those offers and the ease of engaging with them throughout the buying journey. Of course, we always want to ensure we measure the impact of those experiments based on the KPIs that matter – pipeline and revenue.

Optimizing Offers

logistics transportation image of form

What does it mean to optimize offers? There are three components to an effective offer. One, of course, is the offer itself. That item you’re proposing to exchange with that visitor or prospect for them to understand your solution. The more relevant it is, the more effective your ability to convert them will be.

The second important aspect is how you frame it. Our primary focus here is the headline and Call to Action (CTA). Your headline is important because a visitor will spend five or ten seconds deciding if they want to stay on your site or hit the back button and go somewhere else. So, entice them to continue reading the content on the page.

Finally, the third element of the offer is the exchange and how they provide what you want. Most likely on your site this is a web form, but it doesn’t need to be. It’s increasingly common to see conversational marketing tools (chatbots) that accomplish the same thing by providing that medium of exchange for the offer.

Examples

Let’s look at some examples of how you could optimize your offers.

Landing pages are a great starting point for thinking about your offers. Many of you are probably running traffic to dedicated landing pages and putting an offer in front of the visitors hitting it. But not every visitor is interested in the same offer. In the example below, we recognized when working with a customer that they had three viable offers for those visitors coming through their paid campaigns. And rather than only showing them one, we use data to dynamically personalize the offer itself as well as framing and the page layout to reflect what might be most relevant to that visitor.

landing page offers comparison

When we ran the experiment against the static landing page we saw a 44% improvement in revenue per visitor. 

For most of us the most trafficked page on our site is the homepage. And on your homepage the “above the fold” section at the top gets most of the attention. Many of us think about our homepage in the context of welcoming the first time visitor and introducing your solution as in the example below.

fitch-solutions-landing-page

For SaaS and Demand Generation websites it’s common to have a lot of returning traffic. Since return visitors are familiar with your solution, it wouldn’t make sense to show them that same offer. In an experiment, we targeted these return visitors and the solutions they showed interest in and presented them on the homepage. In this case, those offers were buried in the site and require additional navigation. By presenting this offer they would likely be interested in and serving those directly on the homepage, we saw almost 55% improvement in conversions coming through this page.

fitch-solutions-home-page-offers

You can also target well-defined buyer stages. In the following example, we have a customer with a freemium model where visitors on the free plan come to the homepage and see a CTA or a button prompting them to “Upgrade Your Plan”. The baseline experience was to take them to a set of SaaS plan tiers where they could select the one that they would upgrade to. 

pricing-table-personalization-offer

Using this data, we can identify the specific plans most relevant for any individual and offer them directly on the homepage. The framing included the benefits and replaced the CTA with the cost of that specific plan we recommend. Since we recommend a single upgrade plan, we bypassed the plan selection (and the friction it created) and took them directly to the credit card to upgrade. By removing friction and presenting them with a more relevant offer, we saw an almost 70% improvement in revenue per visitor coming through this experience.

buyer-stage-changes-to-website

The most common mechanism of exchange for the offer is the web form, and as a result, we spent a lot of time optimizing them. It’s important to recognize that there’s a lot of friction for the visitor when they encounter one of these forms.Even if they’re interested in the offer, they face the prospect of handing over their email and other personal information, which often presents a big hurdle. Since it’s common to see drop-offs at this stage, we would like to take those contact forms and reinforce the benefit and the value to the visitor filling them out. In the following example, we tested an updated version of the form page resulting in an 85% improvement in conversions.

form-optimization

If you have the data, you can get sophisticated with offer personalization. It’s common to see pages like the one below. It is a product page that contains multiple offers for different personas within the organization. Unfortunately, when you try to put them all on a single page, they compete for attention and blend in, making it hard for users to know which one is relevant for them. 

TIBCO-homepage-before-personalization

In this case, we target specific personas visiting the page based on data we had in the marketing automation platform and identify the most relevant offer. By testing variations that replace the default experience with a single focused offer, we see an almost 50% improvement in revenue per visitor.

TIBCO-homepage-after-personalization

Final Thoughts

It’s possible to waste time, effort, and money optimizing inconsequential elements of your website. For demand generation marketers, the highest leverage things to focus on are the offers – specifically their relevance to the visitor and the ease of engaging with them.

Before you undertake this experimentation it’s important to make sure you have solid revenue insights. What that means is, evaluating your existing offers as well as future experiments based on their pipeline and revenue contribution.

Some of the personalized examples above require some segmentation. Our recommendation is to prioritize segmentation based on the differentiated intent and addressable size of those segments. We often find that marketers are running building audiences that can only address 5-10% of their audience, or ones that don’t have meaningfully different intent from one another. Ultimately those aren’t going to have much value when it comes to optimizing offers.

This is why we start with buyer stages as our starting point for segmentation because it a large set of well-understood segments with differentiated intent – buyers at different stages will naturally gravitate towards different offers. The vast majority of the visitors coming to a demand gen site fit into anonymous, known lead, active opportunity or existing customer.

Finally, when it comes to improving offers, start with common sense ideas. If you start thinking about your buyer stages, some opportunities should become apparent. For example, should a known lead see a lead capture form, or can we repurpose those pixels for something more relevant? Similarly, should existing customers see the “Request a Demo” or “Talk to Sales” CTA? Maybe there’s an opportunity to get them to support resources or event upsell them. 

What’s stopping you from generating more revenue by improving offers on your website? If you’re a Demand Gen marketer and need help, feel free to get in touch.

Go to Top